Stop Watching Charts.
Start Making Money.
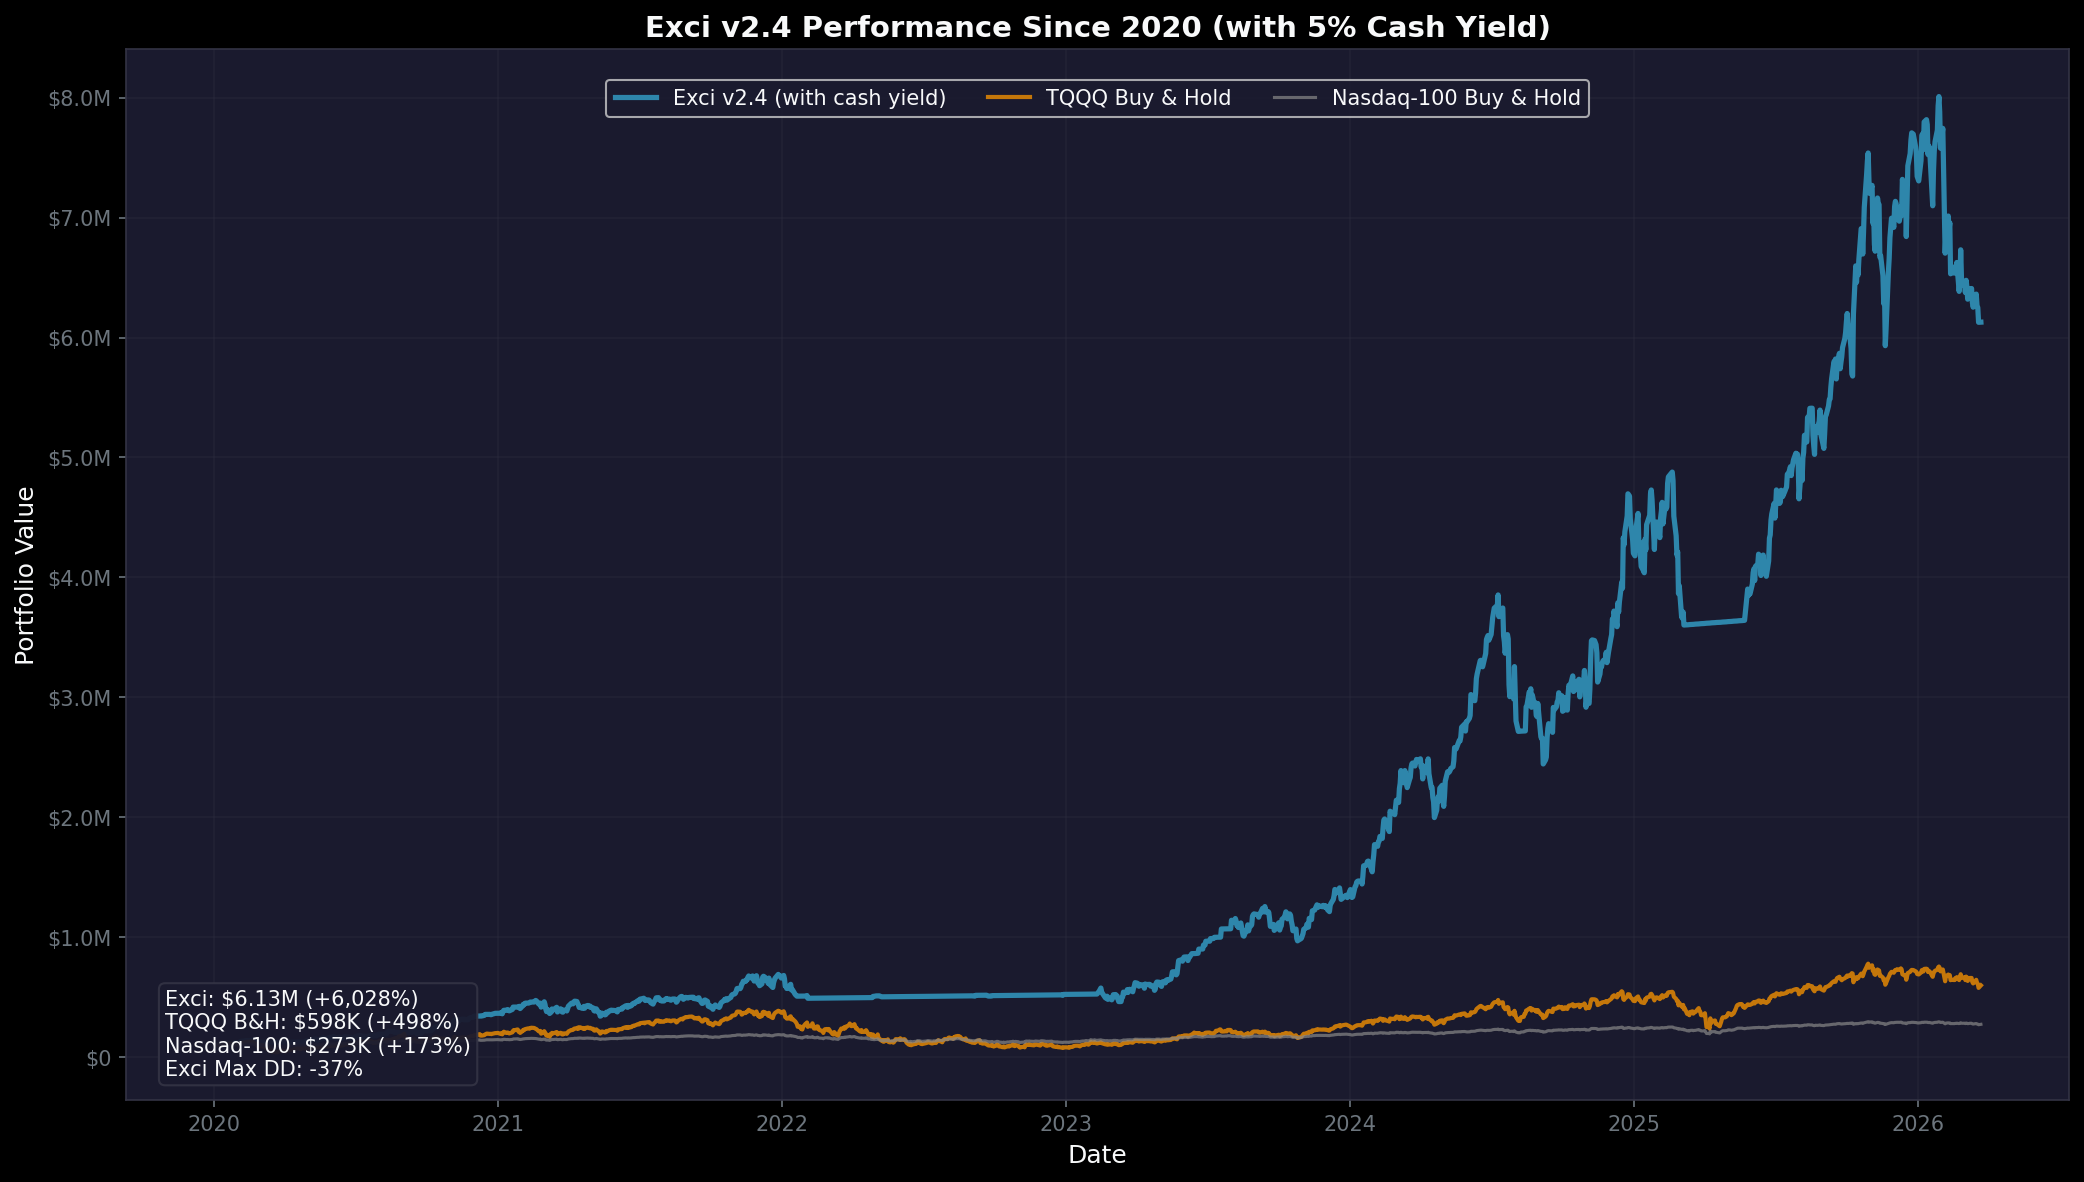
The Exci Trading Bot automatically trades TQQQ for you, delivering institutional-grade returns as passive income.
+6,028%
Since 2020
94%
CAGR
10.3x
vs TQQQ B&H
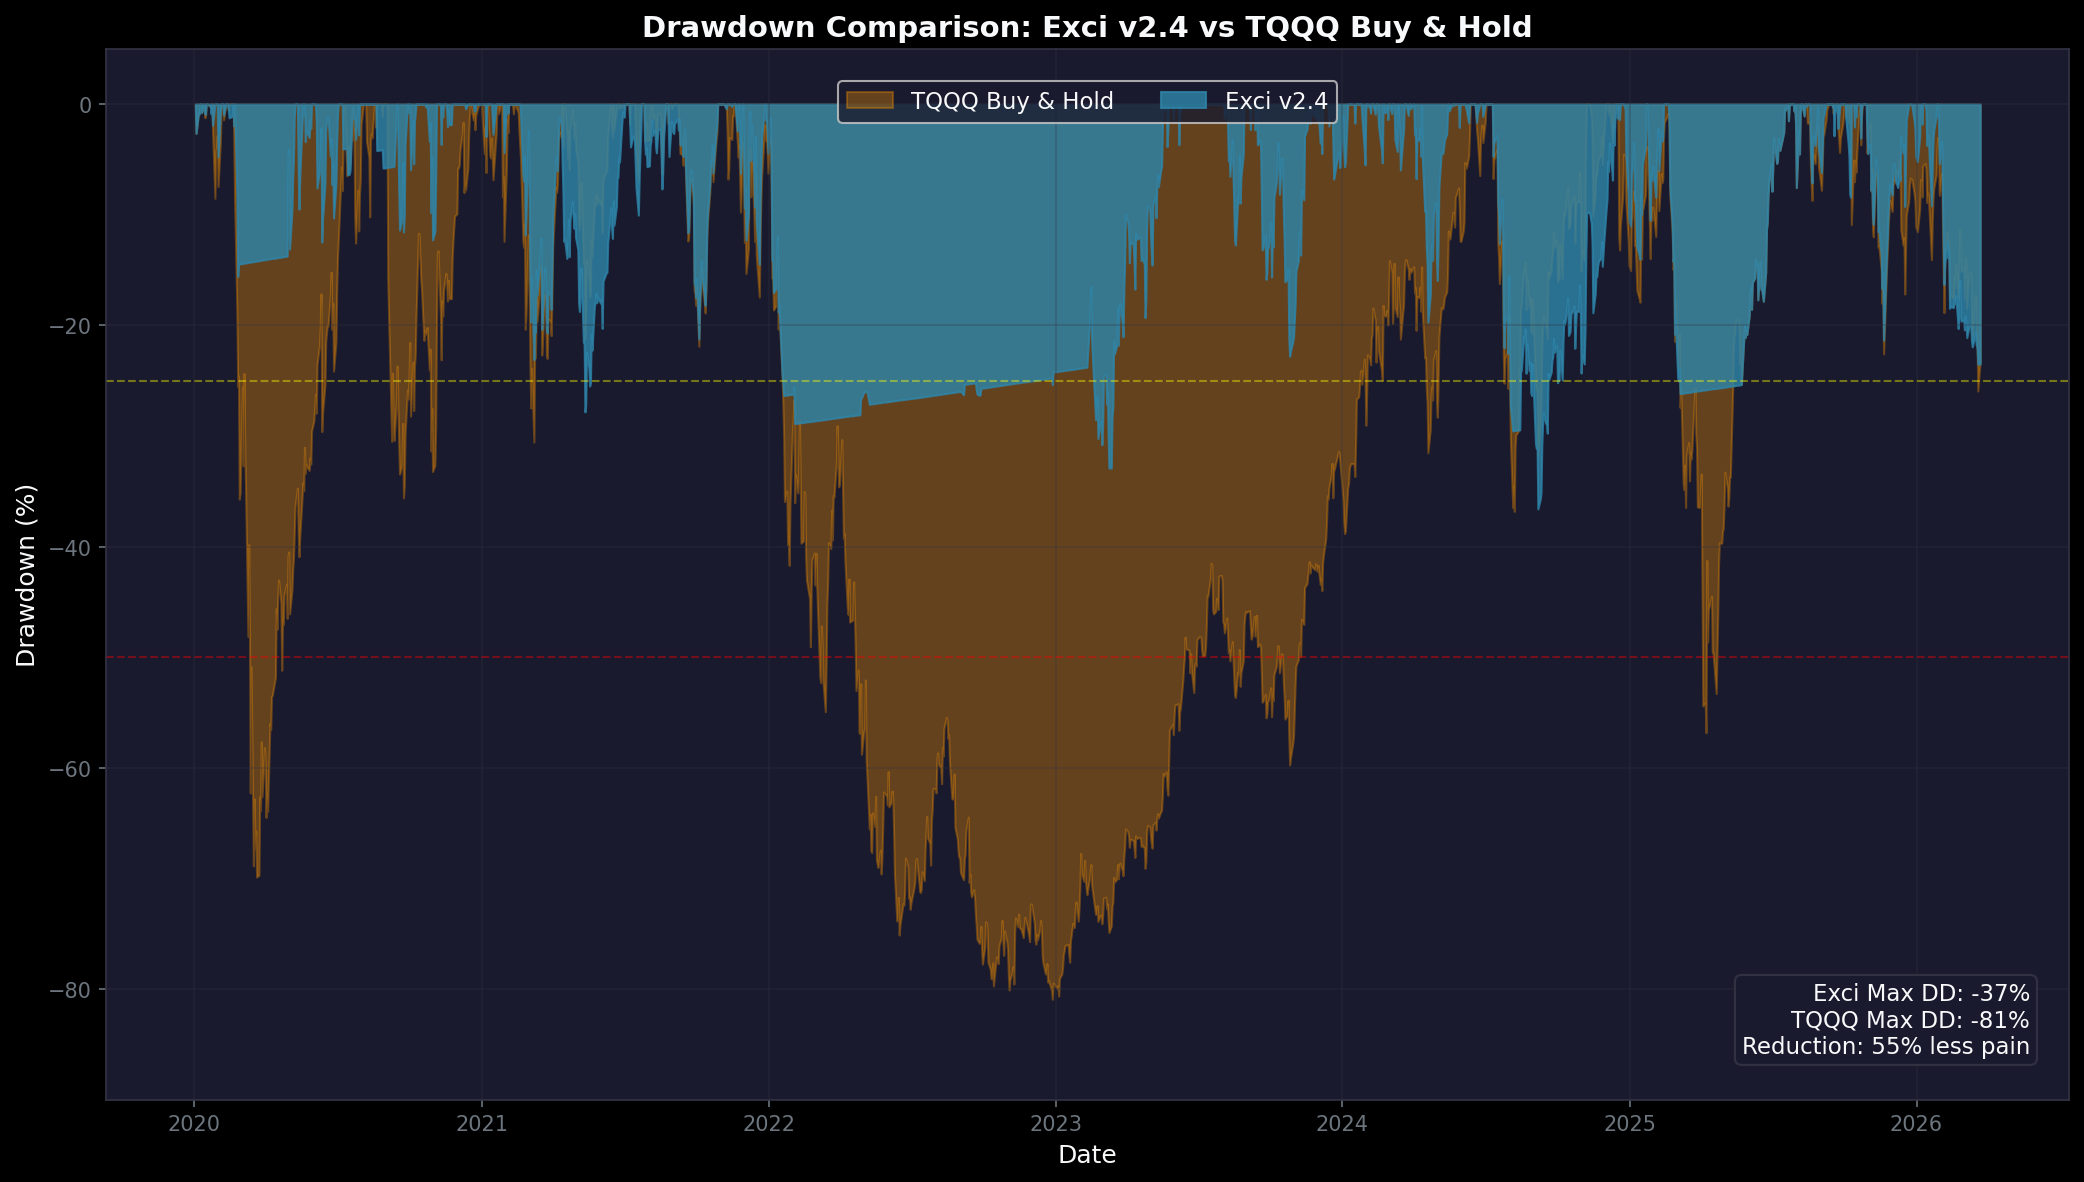
-37%
Max Drawdown